RSI, Reconsidered: The Directional Imbalance Ratio
A reframing of the Relative Strength Index
1. Introduction
This article presents a perspective on the Relative Strength Index (RSI), focusing on how its representation shapes interpretation, and introduces the Directional Imbalance Ratio (DIR) as an alternative way of expressing the same underlying computation.
RSI reduces price data to a single numerical value whose meaning is fully determined by the logic used to derive it. In practice, however, the indicator’s name and scale often influence how that value is read more strongly than the formulaic process itself.
By using a
0-100
scale and the label
“strength,”
RSI presents its
numerical result
in a format that encourages
interpretive reading
alongside the
arithmetic
— a choice that shapes how the value is commonly understood. Conventions layered onto that representation — midpoints, thresholds, and qualitative labels — are frequently treated as
intrinsic features
rather than as
interpretive choices
applied after the fact.
This article does not address trading performance or rules. Instead, it examines how the same computation can be expressed in different ways, and introduces DIR as a signed, symmetric representation that makes direction, balance, and symmetry immediately visible. The goal is not to replace RSI, but to separate how a quantity is derived from how it is interpreted, and to show how representation alone can influence understanding.
Experienced users may already compensate for representational ambiguity; readers encountering the indicator without inherited conventions may benefit from seeing the quantitative summary without added interpretive baggage.
2. Terminology and Scope
This article relies on several terms that are commonly used loosely in technical and market discourse. Because the argument depends on keeping their roles distinct, those terms are defined explicitly here.
These definitions establish how the terms are used throughout the article and clarify what is—and is not—being examined. By grounding the underlying logic in precise language, we can better distinguish the arithmetic process from the narrative layers frequently applied to it.
The following sections define how representation, computation, and inference are treated within this structural logic.
2.1 Price
The term price is used in two different contexts.
In the context of the indicator, price refers to a chosen input supplied to the arithmetic process — for example, a series of closing prices. This series consists of values directly derived from transaction prices generated through market execution. The choice of input affects which data points are summarized, but it does not alter the underlying logic or the form of the indicator’s output.
Regardless of the input selected, RSI always quantifies directional imbalance between upward and downward changes in the selected series over the chosen lookback window. For this reason, the choice of input is treated as a setup detail and is not evaluated or compared further.
In the context of execution, price refers to the transaction price formed through trading at the bid and the ask. Execution mechanics describe how these transaction prices change; they are independent of how prices are later selected, labeled, or organized for the computational engine.
2.2 Parameters
Parameters
define the inputs an indicator accepts as part of its definition. In RSI, these are the lookback period
(n)
and the price input. Users do not choose the parameters themselves; they select
values
for those parameters when applying the indicator.
The lookback period sets how much price history the mathematical process draws from. Changing its value alters the scope of data summarized, but it does not alter what the arithmetic represents. RSI values computed with different lookback lengths therefore describe the same underlying logic, summarized over different portions of past data.
More generally, parameter values change the input window, not the formula. The process is the same; only the lookback length changes, which changes the output values because they summarize a different historical span. Any feature that depends on a parameter value is therefore configurational, not part of RSI’s core definition.
2.3 Representation
Representation refers to how a structural output is presented for reading and use—for example, the numerical scale, sign, or reference point used to express a value.
A difference in representation does not imply a difference in the arithmetic or any new information in the resulting value. It affects how easily the reader can see what the algorithmic process summarizes.
In this article, differences in representation are treated as differences in expression, not differences in what the computational path produces. The goal of a refined representation is to align the data summary more closely with its underlying logic.
2.4 Interpretation
Interpretation refers to the meaning assigned to a quantitative result beyond what the computational logic itself specifies.
Thresholds, labels, narratives, and expectations about continuation or reversal are interpretive overlays. They are applied after the arithmetic is produced and are not treated as intrinsic properties of the indicator.
2.5 Scope
Scope defines what is examined in this article.
This article examines how RSI works mechanically and how its output is expressed to the reader. It does not evaluate trading performance, parameter optimization, or predictive use.
Where interpretation is discussed, it is treated as an external analytical choice, not something contained in the algorithmic process or added by the display conventions. The focus remains on the structural logic of the numerical summary rather than its subjective application.
3. What RSI Actually Quantifies
RSI quantifies the directional imbalance between upward and downward price moves within a defined time window.
Price changes within the observation period are partitioned by direction. Upward changes contribute to one aggregate, downward changes contribute to another, and periods with no change contribute to neither. This structural logic is exhaustive and symmetric: all changes are accounted for, and neither direction is privileged.
The two directional aggregates are accumulated over the evaluation period and compared through a ratio. Because the computational core compares directional outcomes rather than absolute price levels, equal imbalances in opposite directions are treated equivalently, differing only in orientation. The result is bounded, with values near equilibrium when upward and downward changes are balanced and more extreme values when changes are predominantly one-sided.
It is a retrospective accounting tool, not a predictive one. It provides a numerical summary of realized directional outcomes over the selected time period without implying persistence, reversal, or intent. The formulaic comparison reports the score; interpretation follows.
4.
On the
0–100
Scale
RSI expresses directional imbalance on a bounded scale from
0
to
100.
That
representational choice
shapes interpretation before attention turns to the meaning of the value itself.
The
0-100
range provides a
data expression
that frames the
numerical summary
as a percentage of "fullness" or capacity. However, because the
arithmetic architecture
is inherently symmetric, the choice of an unsigned, unidirectional scale forces a
logical mismatch
between the
process
and its display.
4.1 Unsigned Representation
By construction, the RSI’s
structural output
encodes directional dominance in the imbalance between upward and downward price changes. The
0-100
scale, however, removes that direction from the
representation.
Direction must therefore be
inferred
from the midpoint value of
50.
Additional levels, such as
70,
60,
or
30,
further increase the
interpretive burden
by shifting direction from
explicit encoding
to
user-imposed convention.
Within this numerical framework, the lack of a signed value forces the reader to perform mental arithmetic to determine orientation—a step that is not required by the computational path itself, but is necessitated by its unsigned expression.
4.2 Asymmetric Encoding
Directional imbalance is symmetric by definition: an excess of upward price changes and an excess of downward price changes are equivalent conditions in opposite directions. The
0-100
scale does not preserve this
symmetry.
Values above and below the midpoint are therefore encoded asymmetrically, even when they reflect imbalances of equal size. For example, readings of
60
and
40
represent identical departures from balance in opposite directions, yet
60
is often
perceived
as “stronger” and
40
as “weaker” — a distinction influenced by the
representation,
not by the
mathematical engine
itself.
In this
structural logic,
the
quantitative summary
remains neutral, but the scale imposes a hierarchy. The
process
treats both directions as equals, but the
0-100
display creates a
perceptual bias
where one direction is viewed as an
accumulation
and the other as a
depletion.
4.3
The Structural Meaning of the
0–100
Range
On the
0–100
scale, only three values possess a
built-in meaning
defined by the
computational architecture.
These points are not conventions; they are the
logical boundaries
of the math itself.
The most significant is the
midpoint
50.
An RSI reading of
50
simply means that upward and downward price changes perfectly cancel each other out over the chosen time window. This
arithmetic equilibrium
comes directly from the
procedural rules
of the indicator, not from market sentiment. It is a
neutral statement of balance
that does not imply hesitation or any psychological state.
Similarly, the
extremes
0
and
100
represent the
saturation points
of the
underlying logic.
They are the only other values where the quantitative tally reaches a definitive state:
-
100:Every price change within the lookback window was upward. -
0:Every price change within the lookback window was downward.
Unlike the arbitrary
70
or
30
thresholds, these three points —
0, 50,
and
100
— are
intrinsic.
The
0–100
representation obscures this by treating
50
as a "pass-through" point rather than the
structural zero.
By recognizing that the
arithmetic engine
reaches
resolution
only at the points of perfect balance or total dominance, we can see that all other values are merely degrees of
directional imbalance
along a continuous gradient. In this
numerical summary,
any value other than
50
represents a
state of asymmetry,
with
0
and
100
serving as the
terminal poles
where the
computational path
reaches its logical limit.
4.4 Thresholds as Conventions
Thresholds such as
30, 70, 80,
or
20
do not share the
structural role
of the midpoint or the poles. While the midpoint corresponds to a unique condition of
equilibrium,
all other values represent arbitrary coordinates along a continuous
data profile
of imbalance.
Mathematically, imbalance admits no intrinsic breakpoints, Although the computational framework may produce these values, their treatment as “boundaries” or “states” is introduced by convention rather than defined by the algorithmic output.
In this
numerical summary,
70
is no more a "limit" than
68
or
72.
Elevating specific numbers to the status of
thresholds
is an
interpretive act
that happens after the
calculation
is complete. It effectively layers a
binary meaning
— such as "overbought" or "oversold" — onto a
non-binary underlying logic
that reflects only the
magnitude of asymmetry.
4.5 A Symmetric Alternative
A
signed, symmetric scale
makes direction and symmetry
explicit.
On a normalized interval such as
−1 to +1,
zero
corresponds to
balance,
while the sign and distance from zero encode the orientation and
magnitude of the imbalance.
Changing the representation to this format does not alter the numerical result or introduce new assumptions. Instead, it aligns the data expression with the procedural rules of the indicator, leaving the underlying logic itself unchanged.
In this
arithmetic framework,
the
algorithmic output
becomes intuitive: a positive value reflects an upward skew, a negative value reflects a downward skew, and
zero
represents
perfect equilibrium.
The
quantitative summary
is simply
unfolded
to reveal the
computational architecture
that the
0–100
scale obscures.
Furthermore, the
terminal poles
of
-1
and
+1
now serve as functional anchors. They define the
absolute limit
of the
arithmetic engine,
representing the point where directional dominance is total. By centering the
structural zero,
the
data profile
allows the user to perceive the
parity
of opposing market states without the
mental subtraction
required by the traditional scale.
5. Execution Reality Anchor
To understand the directional imbalance RSI summarizes, it helps to connect the underlying structural logic to the mechanics of price change. All indicator values are determined by execution mechanics. Price changes arise exclusively from trades, and indicators summarize the outcomes of that process. How an indicator’s output is expressed does not create these mechanics; it either makes them visible or obscures them.
Here, liquidity is treated as a local execution property. It refers to the capacity of resting limit orders to absorb incoming aggressive orders without a price change. A transaction occurs when an aggressive order removes available liquidity, and a price change follows only when that liquidity is exhausted.
This process has two possible price-changing outcomes:
- If aggressive buy-side executions consume all resting orders at the ask, the price rises.
- If aggressive sell-side executions consume all resting orders at the bid, the price declines.
Against this mechanical backdrop, RSI provides a numerical accounting of the net balance of upward and downward price changes. Because those changes arise only from price-changing aggressive executions, RSI effectively aggregates the relative prevalence of liquidity consumption on the ask side versus the bid side.
When price changes are balanced, the computational process moves toward equilibrium, reflecting comparable rates of aggression. The familiar language surrounding RSI — pressure, strength, exhaustion — adds narrative at the expense of precision. These properties are not recorded by the indicator; they are inferred by the user.
A more detailed treatment is provided in the Market Execution Mechanics tutorial that serves as the mechanical foundation for the quantitative tally summarized here.
6. On the Name “Relative Strength Index”
The name Relative Strength Index reflects descriptive convention rather than the nature of what is quantified. Its components — “relative,” “strength,” and “index” — create expectations that the indicator's structural output itself does not define.
This gap becomes clear when the expectations implied by the name are compared directly to what the mathematical framework actually specifies. The name suggests a qualitative state, while the underlying logic remains a quantitative accounting of directional imbalance.
6.1 What “Relative” Specifies — and What It Does Not
In RSI, the term “relative” refers to the ratio between upward and downward price changes within a single time series over a specified lookback period. In that limited sense, it is technically accurate, but it adds little descriptive value: any ratio is, by definition, relative to its components.
The term neither specifies the dimension being compared nor distinguishes this accounting from other ratio-based indicators. By contrast, describing the quantitative summary in terms of what is being compared— imbalance between upward and downward price changes—makes its basis explicit, without relying on a vague or generic modifier.
Within the computational architecture of the indicator, the "relativity" is simply the arithmetic relationship between two directional sums. Labeling the result as a directional imbalance removes the interpretive ambiguity that the word “relative” often introduces.
6.2 Why “Strength” Suggests More Than Is Recorded
The term “strength” carries a deeper ambiguity. In analytical usage, strength typically implies capacity, persistence, or an underlying property that endures beyond realized price changes—none of which are part of the numerical summary.
Within the arithmetic engine, "strength" has no fixed unit, baseline, or maximum. The midpoint indicates balance between opposing directional changes; it carries no implication of power or weakness, and the extremes do not correspond to any intrinsic market condition. The algorithmic pathway reports only the magnitude of imbalance.
It is common to describe markets as “stronger” when upward price changes dominate, but that description is an interpretive overlay. The structural output itself does not distinguish between dominance as strength, persistence, or durability; it simply reflects the tally observed over the chosen window.
Directional dominance is therefore not equivalent to strength. Values can register at extremes in fragile or corrective conditions because the computational architecture has limited memory that resets as new data enters. Strength, in this context, is an attribution layered onto the result, not a quantity defined by the underlying logic.
6.3 Why RSI Is Not an Index
RSI is not an index in the conventional sense. It is not a composite across constituents or a representative data profile of a system.
Instead, it is a bounded ratio derived from a single price series, scaled for convenience rather than to represent a system-level quantitative summary. While an index typically tracks the aggregate behavior of a group, the procedural rules of RSI focus exclusively on the internal arithmetic relationship of a single instrument's history.
Within this numerical framework, the structural output serves as a standalone tally. Calling it an index implies a scope of observation that the underlying logic does not support.
7. Introducing Directional Imbalance Ratio (DIR)
This article introduces the Directional Imbalance Ratio (DIR) as an indicator that expresses the same underlying arithmetic engine as RSI, but through a signed, symmetric scale.
By shifting the representation, the DIR provides a quantitative profile that makes the orientation of price movement explicit.
The relationship between the two indicators is defined by the following transformation:
This
structural conversion
ensures that the
numerical summary
remains mathematically identical to the original logic while removing the
interpretive burden
of the
0-100
scale.
A reference implementation of DIR for MetaTrader 4 is provided in Appendix B
7.1 Signed, Normalized Imbalance
DIR expresses directional imbalance between upward and downward price changes as a signed, normalized quantity:
- the sign encodes direction (orientation),
- the magnitude encodes the degree of imbalance,
- zero corresponds to balance (equilibrium),
- positive and negative values represent symmetric imbalances in opposite directions.
Its natural range is −1 to +1: the endpoints denote extreme imbalance, and the midpoint denotes equilibrium. This quantitative signature is inherent rather than cosmetic; it follows directly from the procedural logic of the computational path.
By adopting this
numerical framework,
the
arithmetic results
are rendered intuitively. The user no longer needs to mentally subtract
50
to find the
zero-point;
the
structure
of the scale now matches the
underlying mechanics
of the execution process.
7.2 Mapping RSI → DIR
DIR introduces no new arithmetic; it is a linear rescaling of the computational path’s output. This structural translation preserves all information present in RSI while making direction, symmetry, and the meaningful midpoint explicit.
The mapping is defined by these core coordinates:
-
RSI = 50 → DIR = 0(Balance) -
RSI = 100 → DIR = +1(Maximum Upward Imbalance) -
RSI = 0 → DIR = -1(Maximum Downward Imbalance)
Conventional RSI thresholds map directly into DIR under the same procedural rules. For example:
| RSI Level | DIR Equivalent | Interpretation |
|---|---|---|
70 / 30 |
+0.4 / -0.4 |
Significant Imbalance |
60 / 40 |
+0.2 / -0.2 |
Moderate Imbalance |
80 / 20 |
+0.6 / -0.6 |
Extreme Imbalance |
50 |
0.0 |
Equilibrium |
These levels remain interpretive conventions rather than structural boundaries. In the DIR data profile, their parity and distance from balance are immediately visible. This quantitative summary allows the user to see the degree of departure from zero without requiring the categorical "overbought/oversold" narrative.
7.3 Comparison of Encodings: RSI vs. DIR
Expressed as DIR, the representational ambiguities inherent in the
0–100
scale disappear. The
arithmetic engine
remains identical, but the
quantitative signature
is transformed to prioritize clarity:
-
Direction
is explicit through the sign
(+/-). - Symmetry is preserved by construction, centering the structural zero.
- Balance and Imbalance are immediately visible relative to the zero-point.
-
Terminal Poles
at
-1and+1define the logical boundaries of the computational framework. - Thresholds become discretionary preferences rather than structural requirements; the representation itself encodes orientation and parity.
Defined independently, DIR is the normalized difference between cumulative upward and downward price changes over a sampling window. It serves as a data profile of the arithmetic process without the interpretive friction of the traditional index format.
The full mathematical derivation of the relationship between RSI and DIR is provided in Appendix A
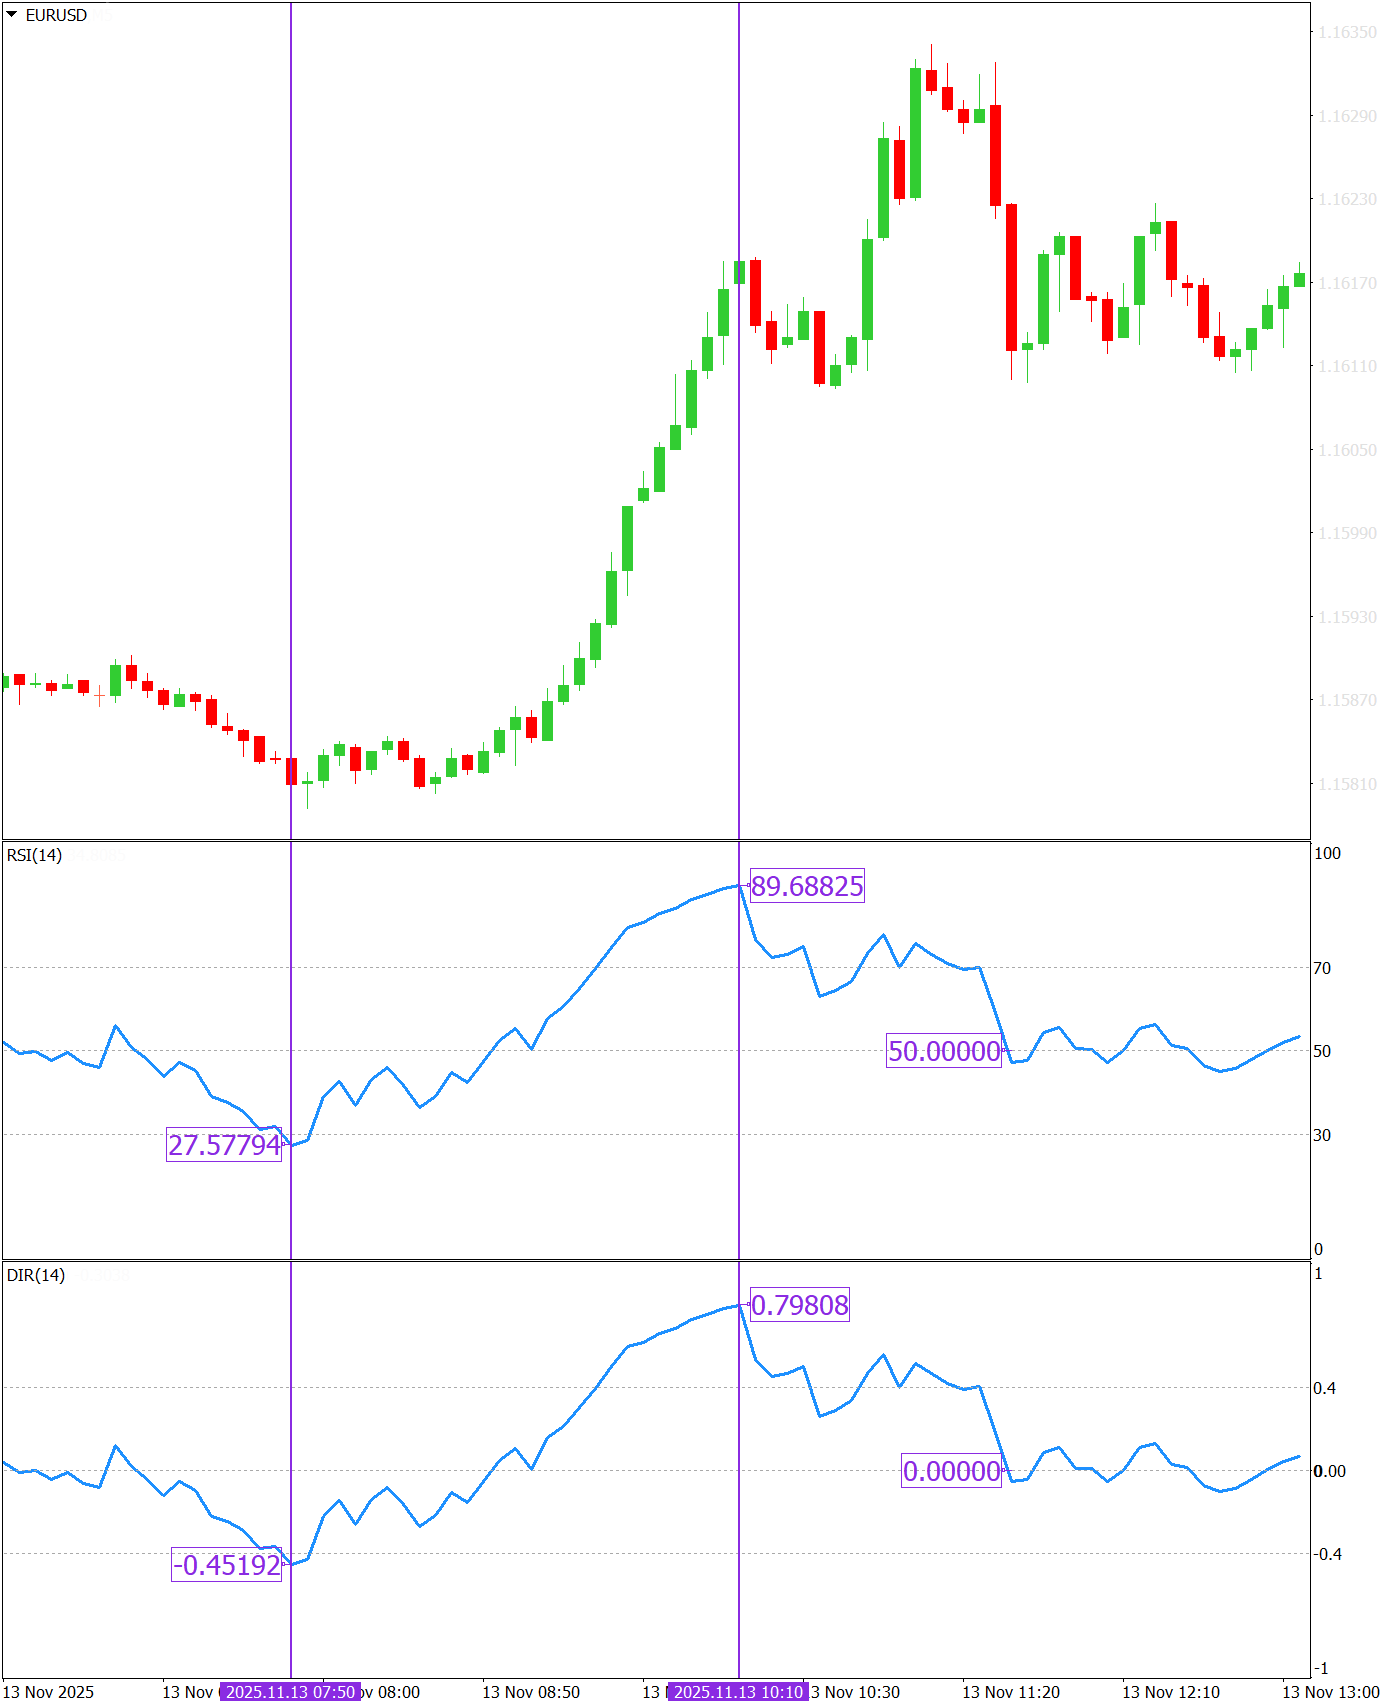
The figure above shows RSI(14) and DIR(14) derived from the same price series over the same lookback period. As the plots make clear, the shapes of the RSI and DIR curves are identical: peaks, troughs, and transitions occur at the same points in time, and the two series evolve in exact correspondence. Selected points are annotated to show the numerical results produced by each indicator at those moments.
This is expected. DIR is a linear rescaling of RSI, not a different underlying logic. No information is added, removed, or altered; only the representation changes.
What differs is how that information is encoded. In RSI, direction must be inferred relative to a midpoint on an unsigned scale. In DIR, direction is encoded directly by the sign, and equilibrium is explicitly anchored at zero. Equal magnitudes of imbalance in opposite directions therefore appear as symmetric values rather than as qualitatively distinct “high” and “low” readings.
The chart is not presented as an example of signal behavior or interpretation. It serves only to illustrate how the same arithmetic appears when direction, symmetry, and balance are made explicit in the data summary.
A reference implementation of DIR for MetaTrader 4 is provided in Appendix B
8. RSI, DIR, and Interpretive Mythology
Interpretive mythology does not arise from a flawed indicator; it arises when an indicator output is asked to answer questions it does not define. With the representational differences between RSI and DIR made explicit, the consequences of obscuring — or revealing — those properties become easier to examine.
Many of RSI’s interpretive conventions originate not from its computation, but from how that computation is presented. An unsigned scale obscures direction, asymmetric encoding obscures symmetry, and a nonzero equilibrium invites searches for "neutral zones." Where the basis of the arithmetic is left implicit, interpretation steps in to supply meaning. Over time, those interpretations solidify into heuristics — overbought and oversold levels, notions of strength and exhaustion, and assumptions of predictive relevance treated as inherent features of the indicator.
Viewed through DIR, the reality that has always been present in RSI becomes explicit. The underlying logic is legible as a signed summary of directional imbalance, with direction, symmetry, and balance apparent. As a result, interpretive overlays — such as thresholds, narratives, and classifications — are clearly distinguishable as additions layered on top of the numerical result rather than conclusions drawn from it.
The value of expressing RSI as DIR is not in replacing one story with another, but in narrowing the gap between what is computed and what is inferred. By making the basis of the process explicit, DIR shifts interpretation to a later stage—where it can be contextual, provisional, and consciously chosen — rather than embedding it in the representation itself, where it hardens into mythology.
9. Why DIR Fits Contemporary Analytical Practice
DIR is proposed because analytical work benefits from clear structure, symmetry, and composability. Whether workflows are discretionary, quantitative, or automated, they operate more effectively when opposing conditions are encoded directly in the values rather than inferred from convention.
9.1 Signed Outputs as a Baseline Expectation
Analytical practice generally expects quantities that encode opposition to do so through sign rather than inference. Across statistics, signal processing, and quantitative analysis, sign conveys direction and magnitude conveys degree, without reliance on interpretive cutoffs or midpoint-based inference.
DIR is consistent with this expectation. Positive and negative values correspond to opposing imbalances, while zero corresponds to balance. Orientation is available from the value itself. This does not change the underlying logic; it changes how directly the calculated result can be read.
9.2 Symmetry and Portability Across Analysis and Automation
Symmetry allows quantities to move easily across analytical contexts. Symmetric representations integrate naturally into aggregation, transformation, modeling, and comparison because opposing conditions are encoded as numerical inverses rather than as offsets from an arbitrary center.
This matters in automated and multi-instrument settings. When quantities are centered at zero and symmetric by construction, they can be combined or transformed without conditional logic or special handling. DIR preserves the built-in symmetry of directional imbalance, making it structurally portable across charting, analysis, and automation.
In contrast, RSI’s asymmetric encoding requires explicit handling of balance, direction, and equivalence. DIR’s advantage is structural, not informational.
9.3 Clarity Aligned With Analytical Requirements
Analytical workflows benefit when structure is visible and interpretation is deliberate. When direction, symmetry, and balance are explicit in the representation, the boundary between the underlying logic and interpretation is easier to maintain.
DIR reflects this preference by making directional imbalance evident in the value itself, while keeping interpretive classifications clearly identifiable as user-imposed. This supports analysis, automation, and modeling by ensuring the arithmetic remains distinct from the narrative assumptions layered upon it.
10. What DIR Does Not Solve
Reframing RSI as DIR clarifies what the underlying logic represents. It does not resolve the interpretive questions often assigned to indicators.
10.1 Categorization Remains Possible
DIR makes direction, symmetry, and balance visible, but it does not encode categorization. Thresholds, labels, or narratives — such as “overbought,” “oversold,” “extreme,” “overextended,” or “reversal-prone” — remain deliberate, user-imposed modeling decisions, not attributes of the calculation or its representation.
10.2 Lookback Selection Remains External
Lookback selection remains external. DIR, like RSI, summarizes directional imbalance over a chosen window, but the choice of lookback period reflects analytical intent rather than a property of the underlying logic itself.
No representation can infer time relevance on the user’s behalf. The arithmetic provides a summary of the selected window, but the determination of whether that window is relevant remains a user-imposed parameter.
10.3 Context Remains Non-Negotiable
DIR does not supply context; it summarizes directional imbalance in price changes but does not encode regime, volatility, market structure, or information outside the price series itself. Expressing the underlying logic more clearly does not eliminate the need for judgment; it clarifies what the numerical result contributes and what it does not.
The arithmetic remains a closed system. While the representation is improved, the requirement for contextual analysis remains external to the indicator itself.
10.4 Expectation Management
Expectations about continuation, reversal, acceleration, or decay are inferences layered onto the arithmetic, not properties of the underlying logic itself.
Reframing RSI as DIR narrows the scope of what the indicator output is asked to do: it makes explicit the boundary between the calculation and inference without crossing that boundary on the user’s behalf.
11. Computation and Interpretation
11.1 RSI Reconsidered, Not Rejected
This article does not argue against RSI as an arithmetic process. Its computation is coherent, internally consistent, and structurally sound. What has been reconsidered is not the calculation itself, but how it is presented and named.
The issues addressed here arise from representation, not from the indicator’s underlying logic. DIR re-expresses that same numerical process in a form that makes its structure visible without interpretive mediation.
11.2 DIR as a Linguistic and Representational Correction
DIR is a linguistic and representational correction: a signed, symmetric expression of an existing computation whose structure is not made explicit in RSI’s conventional naming and scale.
DIR uses a name and scale that reflect the arithmetic, removing interpretive prompts that encourage premature inference and restoring symmetry, direction, and balance to the representation. By aligning the data summary with its underlying logic, the indicator is transformed from a source of mythology into a transparent analytical tool.
11.3 What Is Computed Is a Starting Point, Not an Answer
Neither RSI nor DIR answers questions about intent, regime, durability, or what comes next. They describe what has occurred within a defined window—nothing more. Any interpretation beyond that description is an analytical choice layered on top of the underlying logic.
Terms such as “overbought” and “oversold” reflect common interpretive conventions, not properties defined by the computation itself.
Clearer representation does not eliminate interpretation; it relocates it. When structure is explicit, interpretation becomes deliberate rather than implicit. The arithmetic remains the starting point of analysis, not its conclusion. The distinction between the quantitative result and inference is preserved.
12. Conclusion: Making the Arithmetic Explicit
The Relative Strength Index has endured not because of mythology, but because the arithmetic it computes is coherent and stable. RSI summarizes directional imbalance in realized price changes over a defined lookback period. That fact has always been true, regardless of how the indicator is labeled or displayed.
What has been obscured is not the
computation
itself, but how it is
presented.
An unsigned
0–100
scale, coupled with a name that implies
persistence
and
capacity,
invites interpretation to step in where structure is not
explicit.
Over time, those interpretations harden into convention and are treated as properties of the indicator itself. The result is not analytical error, but conceptual drift: RSI is asked to answer questions it does not define.
Expressing RSI as the Directional Imbalance Ratio does not change the underlying logic. It changes what is immediately visible. Direction is encoded by sign. Balance is encoded at zero. Symmetry is preserved by construction. Interpretation, if applied, is clearly layered on top of the quantitative summary rather than embedded within it.
This change does not argue against thresholds, heuristics, or discretionary narratives. It restores the boundary between the arithmetic and inference. When structure is explicit, interpretation becomes a deliberate analytical choice rather than an inherited assumption.
RSI does not need to be abandoned. It benefits from being read for what it is. DIR is one way of doing so.
For readers interested in practical use, Appendix B provides a downloadable MT4 implementation consistent with the representation discussed here.
Appendix A. Relationship Between RSI and DIR
This appendix formalizes the relationship between RSI and DIR for completeness. It introduces no new assumptions and does not alter the underlying computational architecture.
A.1 RSI Construction (Summary)
RSI is derived from two accumulated quantities over a lookback period n:
- U: cumulative upward price changes
- D: cumulative downward price changes (expressed as positive values)
The relative strength is defined as:
The procedural framework then rescales this ratio to a bounded interval:
This transformation produces values in the range
0
to
100,
with
50
corresponding to the condition
U = D.
A.2 DIR Definition
DIR is defined as a signed, normalized expression of the same imbalance:
This quantity lies in the range
−1 to +1:
- DIR = 0 when U = D
- DIR = +1 when D = 0 (Terminal Upward Pole)
- DIR = −1 when U = 0 (Terminal Downward Pole)
A.3 Linear Mapping Between RSI and DIR
RSI and DIR are related by a simple linear transformation. To derive the DIR from an existing RSI value, the numerical process is:
Conversely, to project a DIR back into the traditional 0–100 arithmetic summary, the algorithmic blueprint requires explicit grouping to maintain the computational path:
This mapping preserves all information present in RSI while making direction, symmetry, and balance explicit. No interpretive thresholds are introduced or removed by this procedural logic. Any thresholds applied to RSI map directly to corresponding DIR values; they remain interpretive conventions rather than structural features of the algorithmic pathway.
Appendix B. DIR Indicator for MT4 (Download)
The Directional Imbalance Ratio can be implemented directly in MetaTrader 4 as a custom indicator by applying a linear rescaling to the RSI output. For reference and practical use, the MT4 implementation used to generate the DIR plots in this article is made available for download.
The indicator expresses the numerical profile as:
This transformation retains the arithmetic signature of the original data while expressing it on a signed, symmetric scale centered at zero .
Available Downloads
- Download DIR.mq4 – MT4 indicator source code. This file can be compiled in MetaEditor and attached to a chart like any standard custom indicator.
- Download dir-mt4.zip – A packaged archive containing the source file and a brief README with installation notes.
The indicator uses MT4’s built-in RSI function internally and exposes the standard configuration parameters (lookback period and price input). No modifications are made to the procedural framework itself; only the data expression of the output differs.
The provided code is intended as a reference implementation consistent with the computational architecture discussed in this article. It does not embed trading rules, signals, or interpretive logic.